The dashboard shows how your site is doing: how many trucks were booked, how long they took, how busy the docks were, and what needs attention today. It shows the site picked in the site switcher, and it updates by itself as trucks check in, dock and leave.
Choose what you're looking at
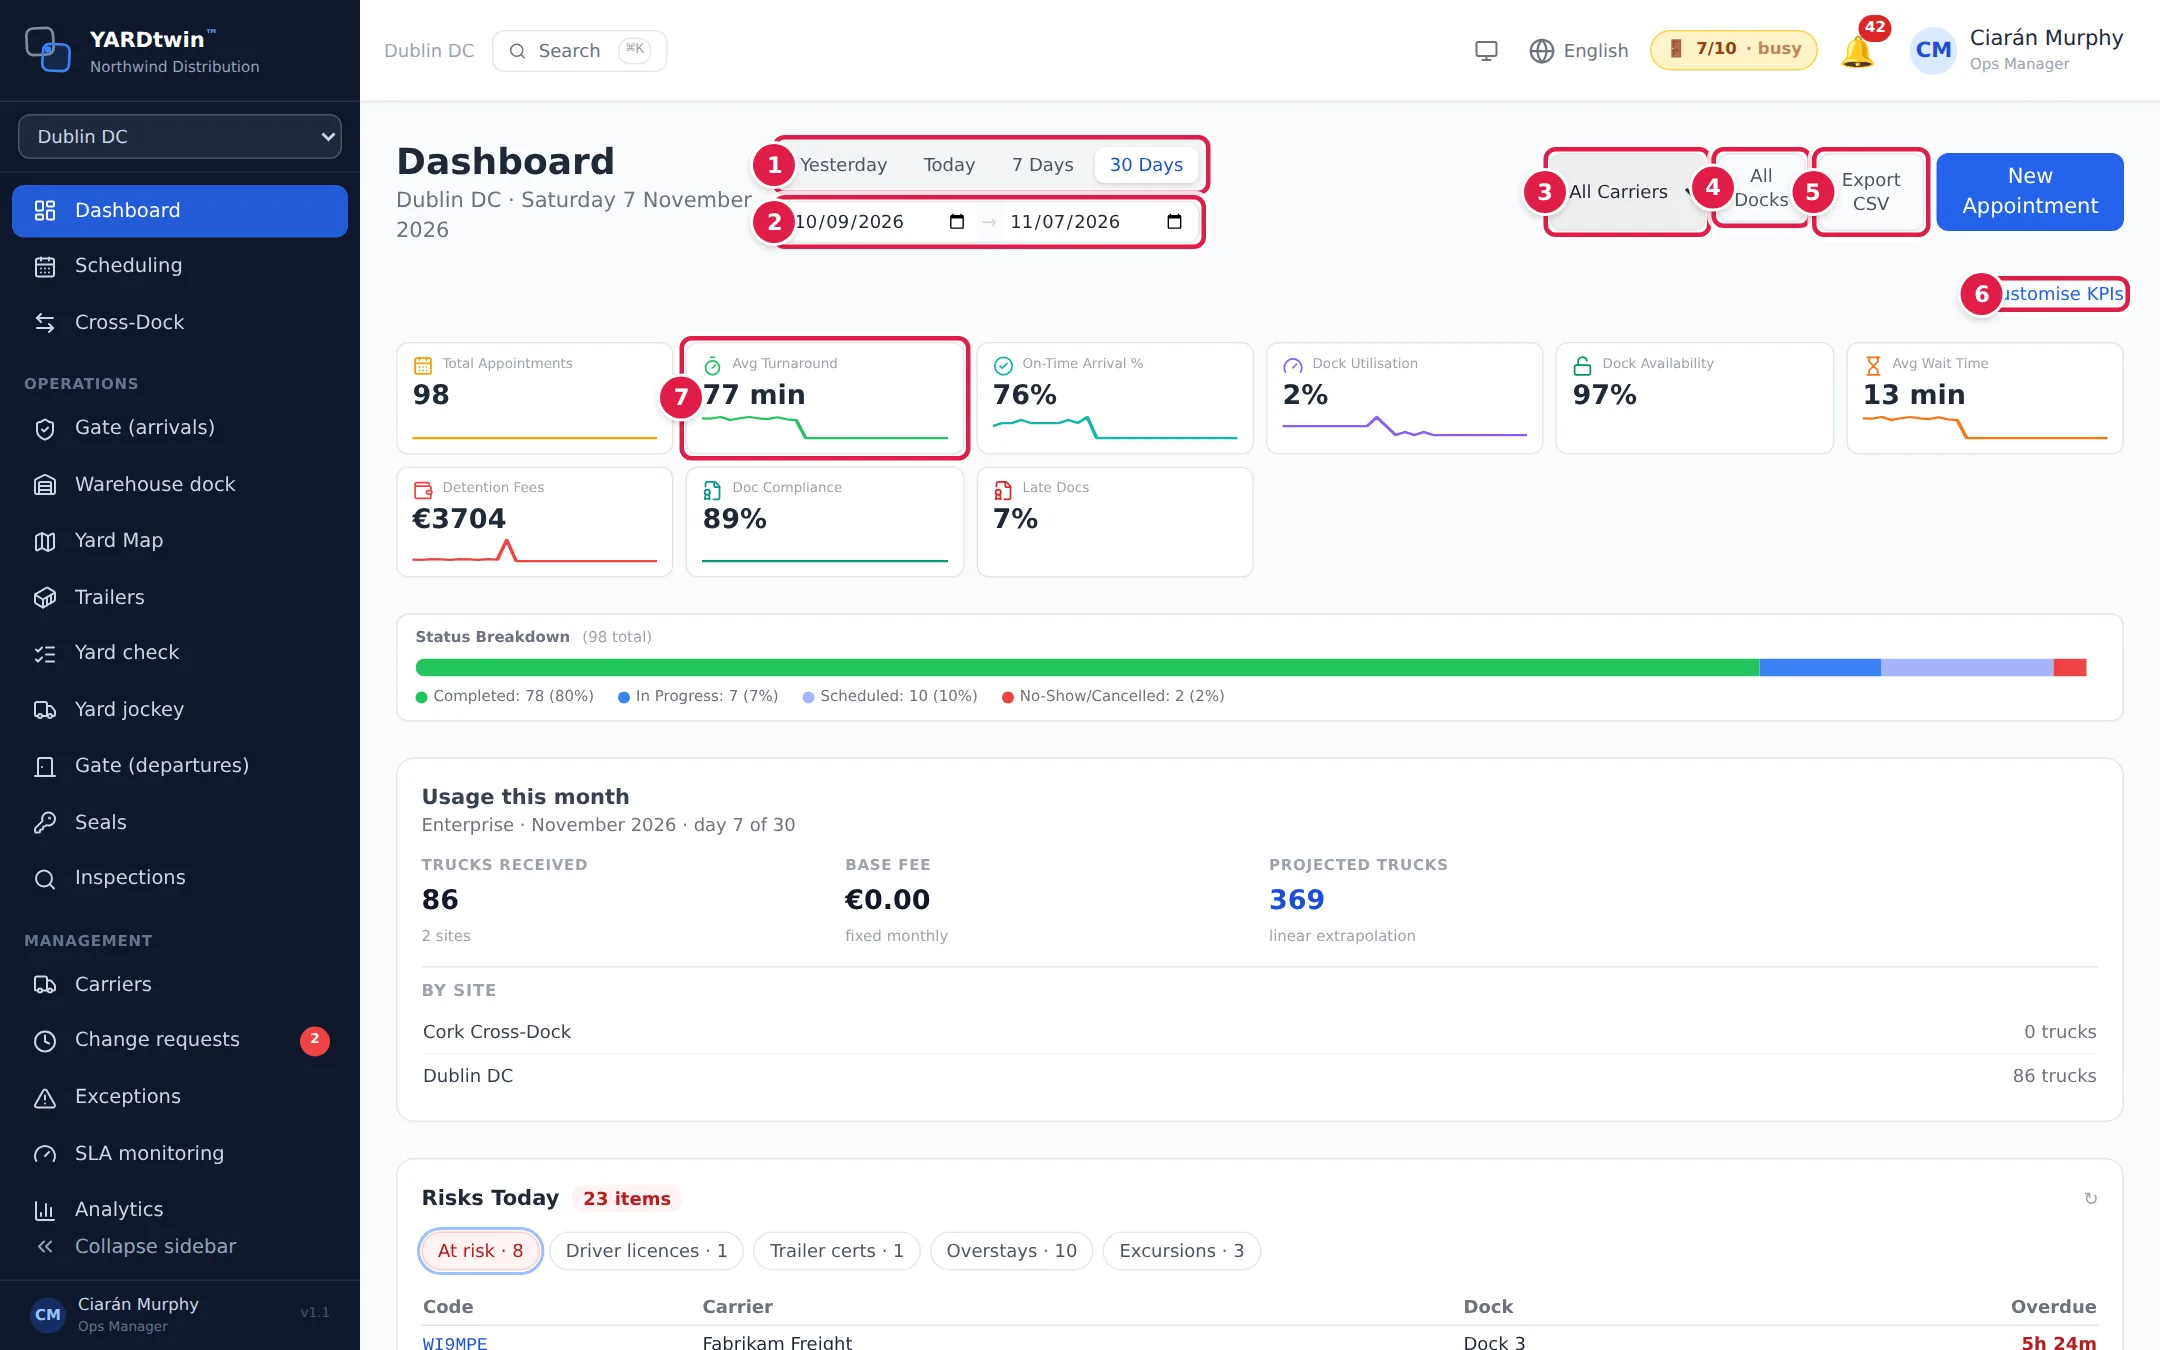
- Pick a period: Yesterday, Today, 7 Days or 30 Days. The dashboard opens on 30 Days.
- Or set your own period with the two dates, from and to.
- All Carriers lets you look at one carrier only.
- All Docks lets you tick the docks you want, then click Done. Clear All goes back to every dock. The dock choice changes the status breakdown and the charts. It doesn't change the KPI tiles.
- Export CSV downloads the bookings on screen as a spreadsheet file: the period, carrier and dock you picked. It has the date, time, booking code, carrier, dock, type, status, turnaround, wait, detention fee, truck registration and driver.
- Customise KPIs lets you choose which tiles you see. Click a tile name to pin or unpin it, then click Done. YARDtwin remembers your choice on this device.
- Each KPI tile shows the figure for the period, with a small line showing the trend. Point at a tile to see what it measures. Click a tile to see it in detail (see below).
Dates follow the site's time zone (set in Site Admin), so Today is the site's day wherever you are.
New Appointment at the top right takes you to the scheduling board. See Book an appointment.
What the KPI tiles mean
| Tile | What it measures |
|---|---|
| Total Appointments | Bookings in the period. |
| Avg Turnaround | Average time from a truck arriving to it leaving. It includes waiting, docking, loading or unloading, and checking out. |
| On-Time Arrival % | Completed visits whose truck arrived no more than 15 minutes after its slot started, in the site's time. Visits with no arrival recorded are left out. |
| Dock Utilisation | Share of the docks' hours in the period that had a truck on the dock. |
| Dock Availability | Share of the docks' hours that were free. It leaves out time with a truck on the dock and the buffer after each truck leaves for staging and put-away. |
| Avg Wait Time | Average time from gate check-in until the truck reaches a dock. |
| Detention Fees | Total detention charged in the period. See Detention. |
| No-Show Rate | Share of the period's bookings where the truck never arrived, as a percentage. Its trend line and its charts count the no-shows. |
| Active Trucks | Trucks on site right now. |
| Time on Dock | Average time a truck spent at the dock. |
| Doc Compliance | Share of documents uploaded before the truck arrived. |
| Late Docs | Share of arrived deliveries with at least one document uploaded after gate check-in. |
| Completed Today | Today's bookings (the site's date) that are completed: departed, complete or checked out. It doesn't change with the period. |
Tiles show — when there's nothing to measure yet, for example a turnaround before any truck has left.
Drill into a KPI
Click a tile to see it over time.
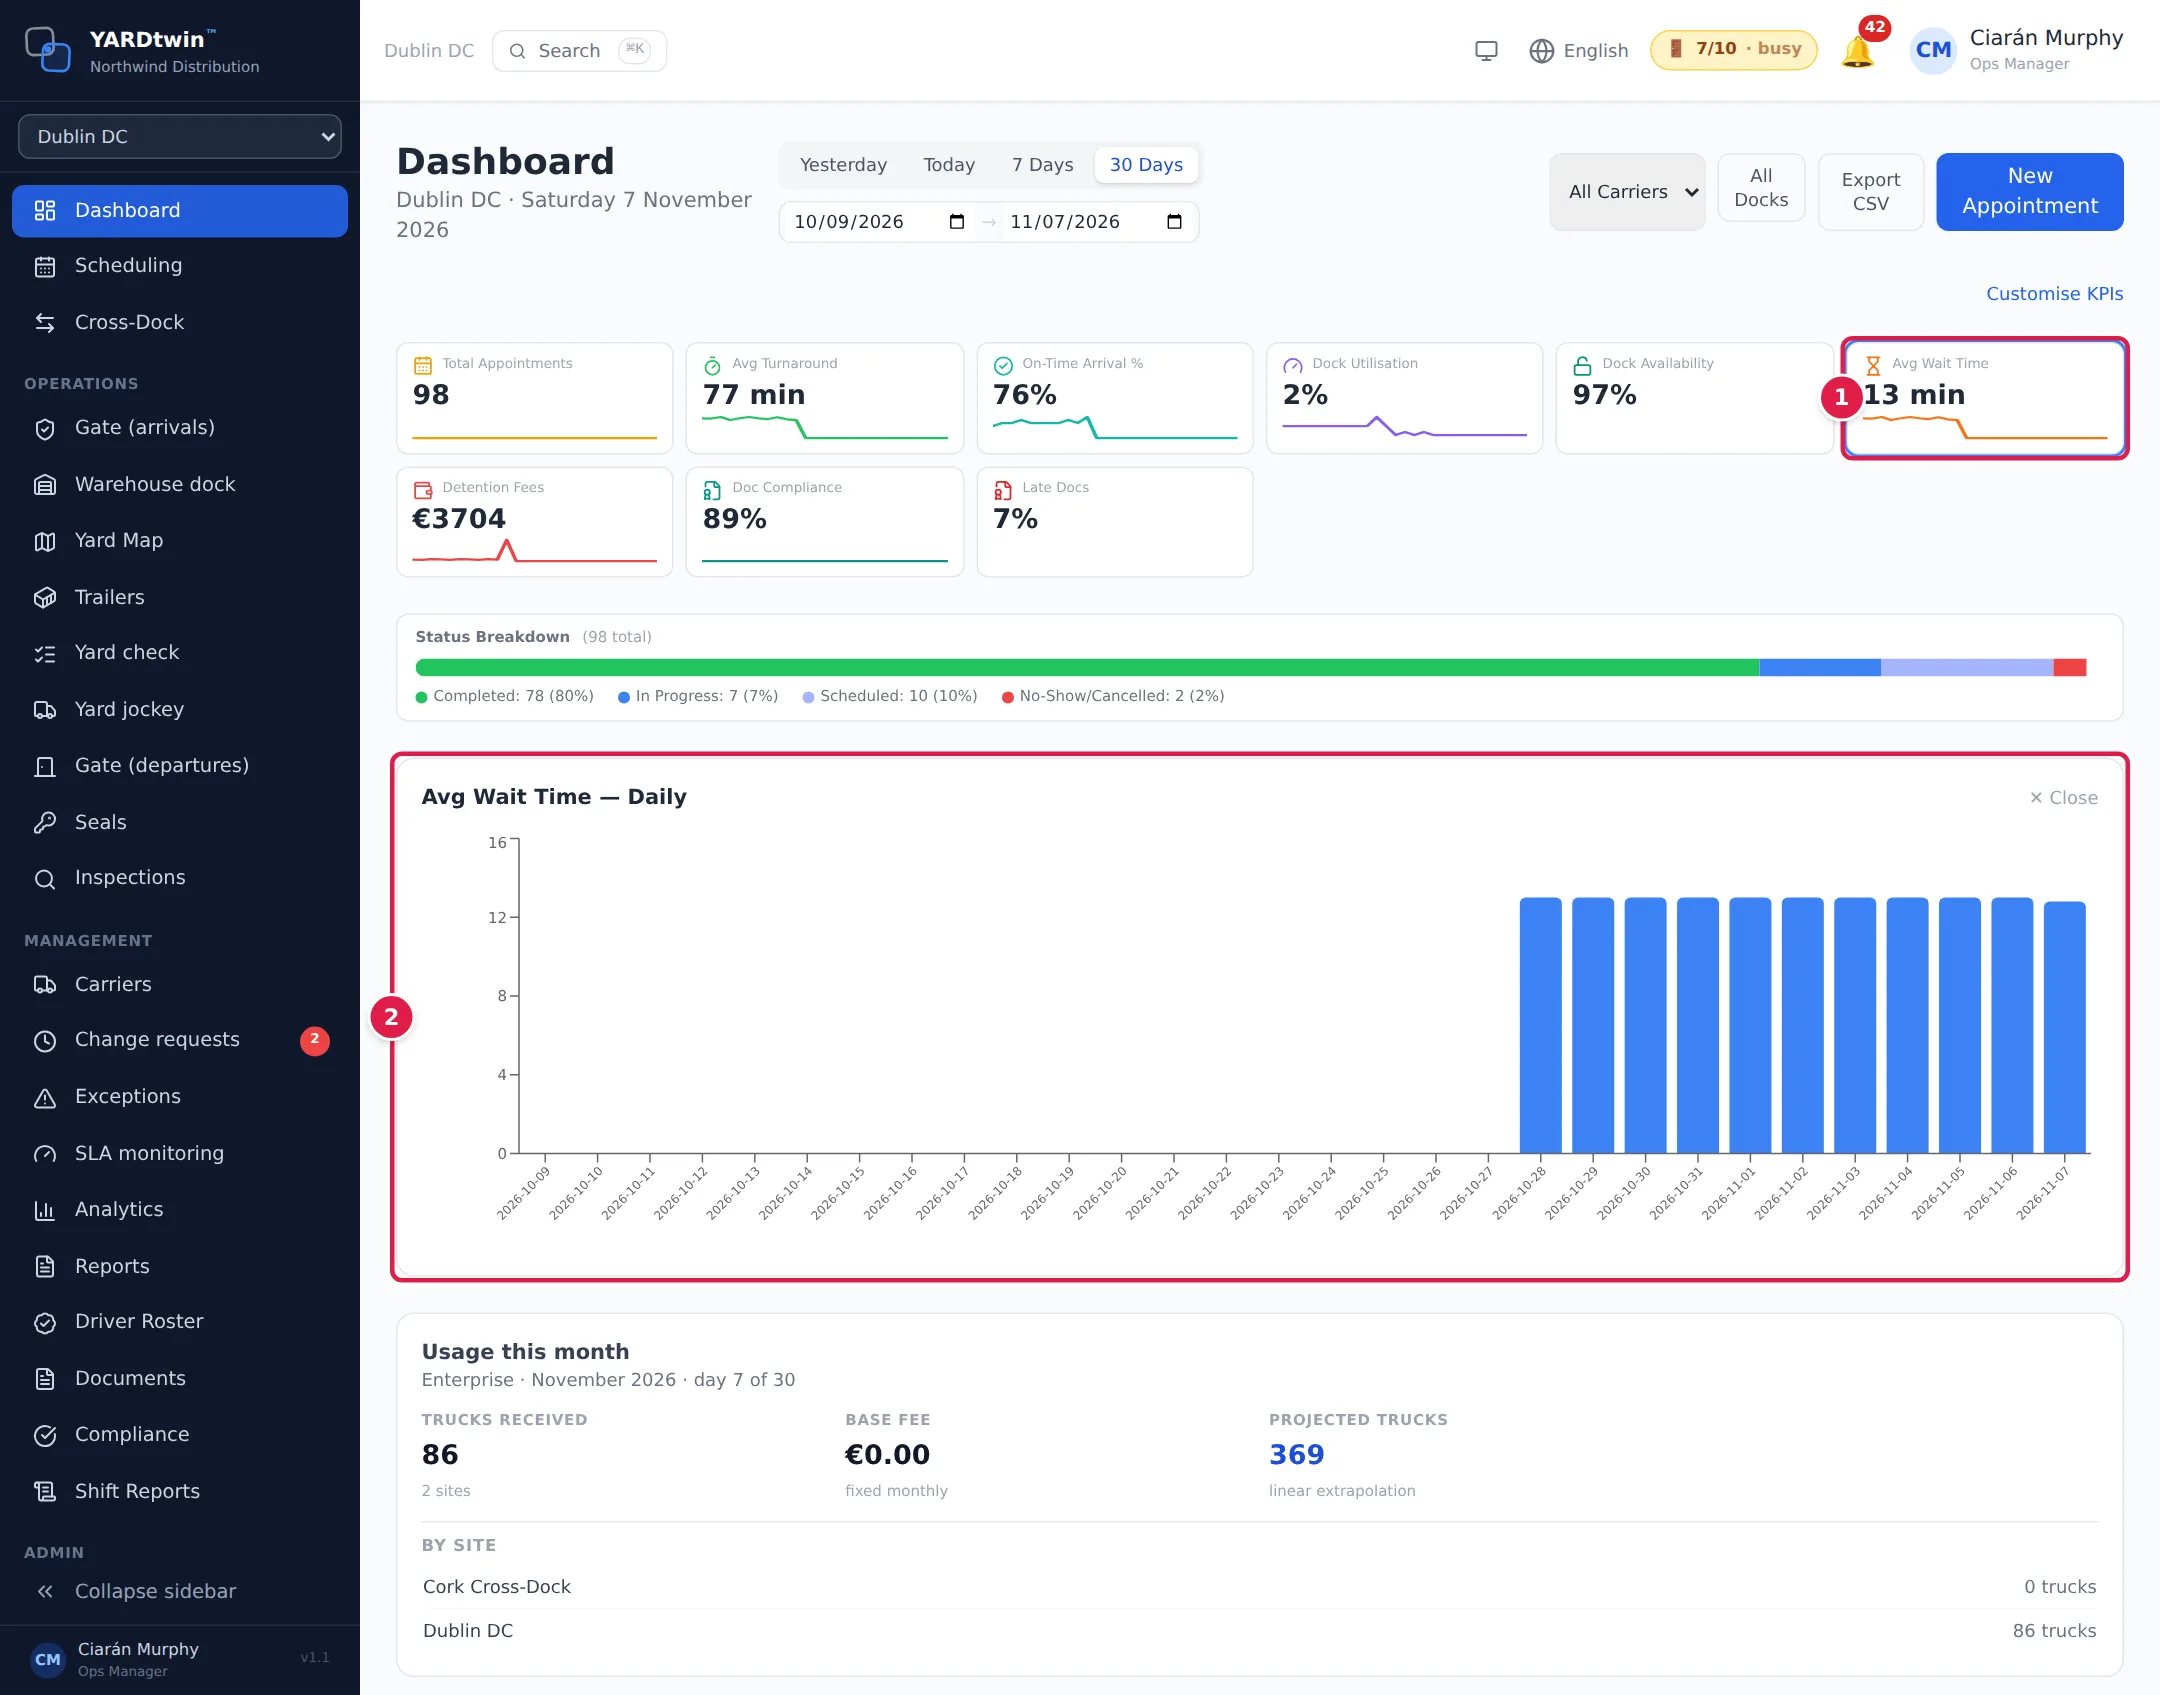
- The tile you clicked is outlined.
- A chart shows that KPI for each day of the period, or for each hour if you're looking at a single day. Click ✕ Close, or the tile again, to hide it.
The charts further down the page also switch to that KPI: … by Time of Day (06:00 to 20:00), … by Carrier and … by Dock. With no tile selected, they count bookings. For On-Time Arrival %, each bar uses the tile's measure, so the bars agree with the tile.
Status breakdown
The coloured bar under the tiles splits the period's bookings into four groups, with counts and percentages:
- Completed: departed, complete or checked out.
- In Progress: arrived, checked in, docked, loading or unloading.
- Scheduled: scheduled or confirmed, not yet arrived.
- No-Show/Cancelled.
For what each status means, see Booking statuses.
Usage this month
This card shows your plan, the month, and how many trucks were received at the gate this month, site by site, with a straight-line projection to the end of the month. On the Standard plan it also shows your position against the fair-use line. Administrators also see View detailed usage →, which opens Site Admin → Billing. See Plans and the free trial.
Risks today
Administrators, ops managers, yard managers and operations staff also see Risks Today: one card with the things that need action now.
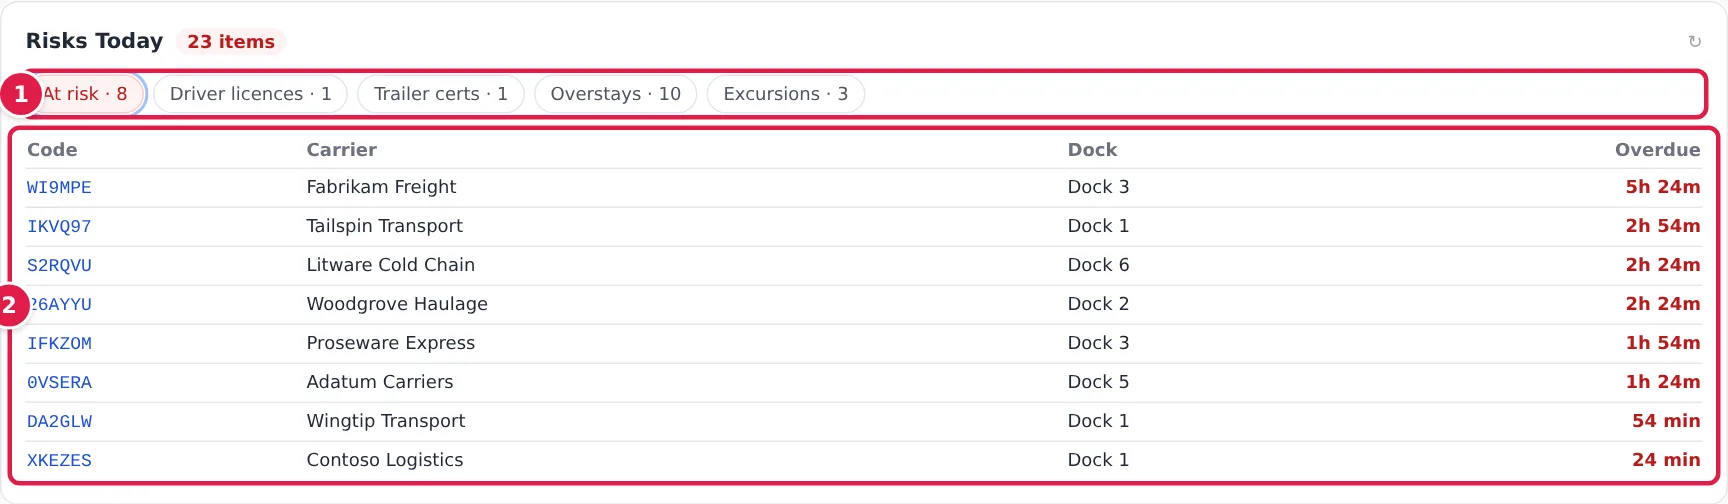
- Click a tab to see that kind of risk. The number on each tab is how many there are. The title shows the total, or All clear.
- The list for the tab you picked. Click a booking code to find that booking on the scheduling board.
| Tab | What it lists |
|---|---|
| At risk | Trucks booked for today (the site's date) that are more than 15 minutes past their slot, in the site's time, and haven't arrived, with how overdue they are. |
| Driver licences | Drivers whose licence expires in the next 30 days, with how many bookings they have before then. |
| Trailer certs | Trailers whose cold-chain certificate expires in the next 30 days. |
| Overstays | Trailers on site longer than their free time, with their dwell and the free time that applies. |
| Excursions | Cold-chain temperature excursions today. |
The ↻ button at the top right of the card reloads the page.
AI insights
AI Insights gives a few plain-language observations about the bookings on screen: how many completed, the average turnaround against the on-time rate, which carriers and docks were fastest or slowest, and which times of day are busiest. If you've clicked a KPI tile, the insights focus on it. They change with the period, carrier and dock filters.
The on-time rate in the insights is the On-Time Arrival % tile's figure. Like the tile, it covers every dock: with docks picked, the insight says so.
If something goes wrong
- The tiles show "—" or 0. There are no bookings, or no finished visits, in the period for this site. Try 30 Days, check the site switcher, and clear the carrier filter.
- The dock filter didn't change the tiles. That's expected: the dock choice only filters the status breakdown and the charts.
- The export doesn't match the tiles. The export lists the bookings on screen, with the dock filter applied. The tiles ignore the dock filter.
- Your tile choice has gone. Tile choices are saved in your browser. A different computer, or a browser with its data cleared, shows the standard tiles.
- You don't see Risks Today. It's shown to administrators, ops managers, yard managers and operations staff only.