SLA monitoring checks every active carrier against four service-level targets and colours the result: green On track, amber At risk or red Off target. Use it to decide which carriers to talk to. It covers all your sites together.
Read the table
Open SLA monitoring in the menu.
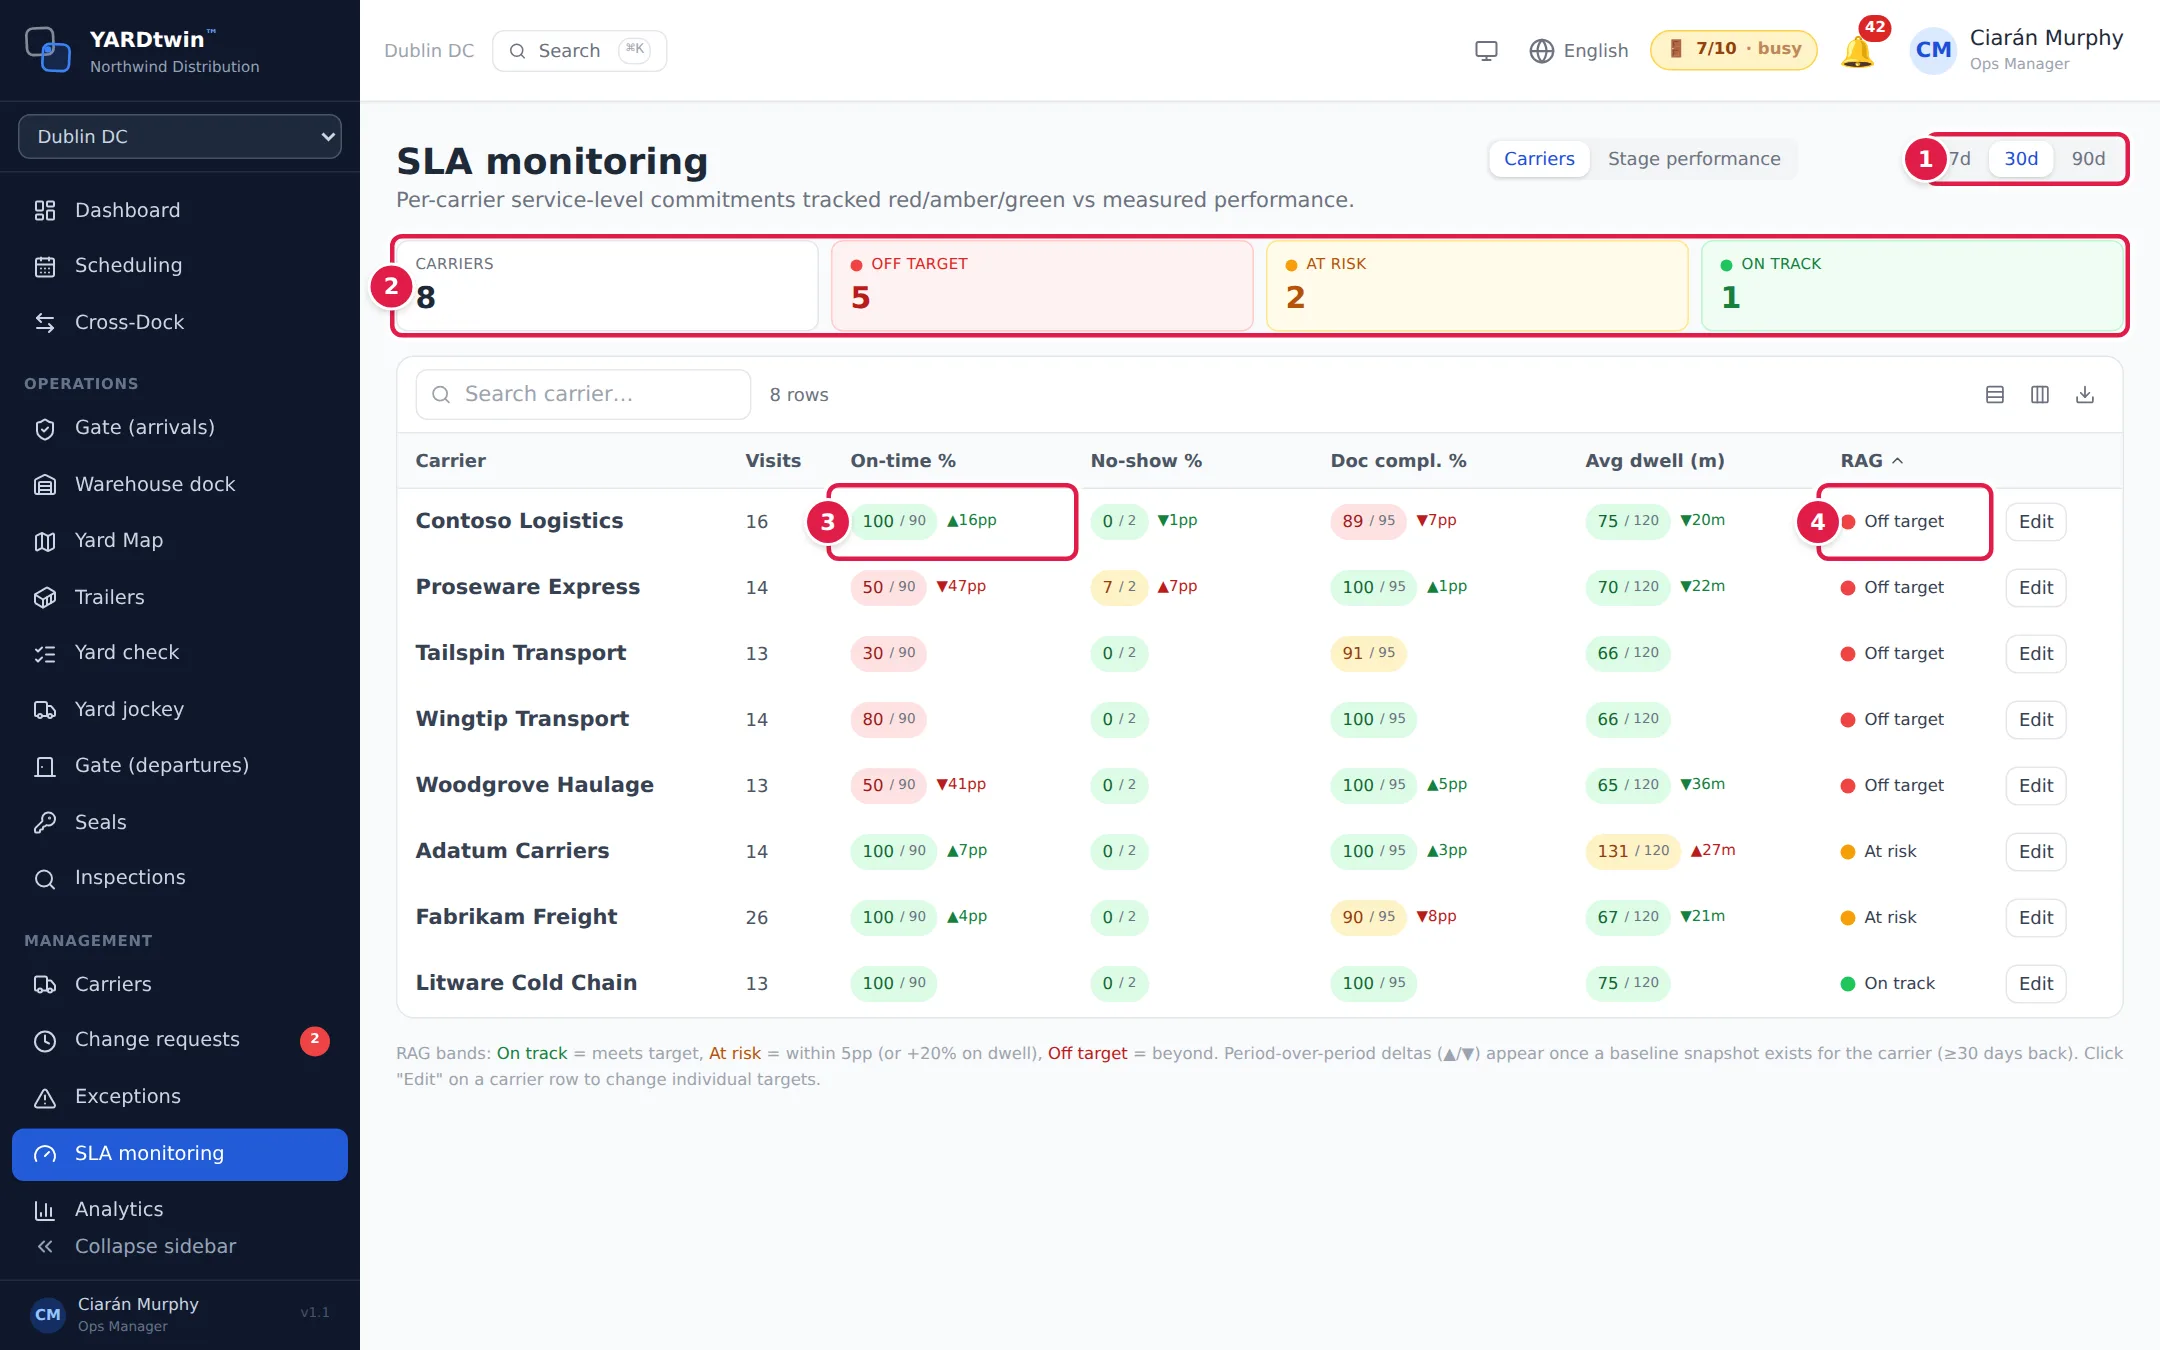
- Pick the period: 7d, 30d or 90d. It opens on 30d.
- The tiles count your Carriers, and how many are Off target, At risk and On track overall.
- Each measure shows the carrier's result, then the target after the slash, for example 88 / 90. Its colour shows how close it is. A small ▲ or ▼ shows the change since the previous period, once there's enough history to compare: in percentage points (pp) for the percentages, in minutes (m) for dwell.
- RAG is the carrier's overall result: the worst of its four measures. Carriers that are off target come first.
Use Search carrier… to find a carrier. The icons at the right of the table change the row height, show or hide columns, and export the table as CSV, Excel or PDF.
What the measures mean
| Column | What it measures | Default target |
|---|---|---|
| Visits | Bookings for the carrier in the period. | — |
| On-time % | Completed visits where the truck arrived no more than 15 minutes after its slot started, in the site's time. Visits with no arrival recorded are left out. It's the same measure as the dashboard's On-Time Arrival %. | At least 90 |
| No-show % | Bookings where the truck never arrived. | No more than 2 |
| Doc compl. % | Documents for completed visits that were uploaded before the truck arrived. | At least 95 |
| Avg dwell (m) | Average minutes from arrival to departure. | No more than 120 |
How the colours are decided:
- On track: the target is met.
- At risk: missed by up to 5 percentage points, or, for dwell, up to 20% over the ceiling.
- Off target: missed by more than that.
- No data: nothing to measure yet, for example no completed visits.
Change a carrier's targets
Administrators and ops managers can set targets for each carrier. For example, a carrier coming a long way might get a longer dwell ceiling. Click Edit on the carrier's row. Yard managers can read the table, but the Edit button isn't shown to them. A Targets for … panel opens under the table.

- Type the new On-time target %, No-show ceiling %, Doc compliance target % and Dwell ceiling (min). Leave a box empty to use the default (90 / 2 / 95 / 120).
- Click Save. YARDtwin shows SLA targets updated. and recolours the table.
Cancel closes the panel without saving.
If something goes wrong
- No Edit button. Only administrators and ops managers can change targets. Yard managers can read the table but not change it.
- A carrier shows "No data". It had no bookings, or no completed visits, in the period. Try a longer period.
- A carrier is missing. Only active carriers are listed. See Manage carriers.
- No ▲ or ▼ arrows. They appear once YARDtwin has a record of the carrier's results from the previous period.
Stage performance
The Stage performance view (the switch beside the time window) shows how long each stage of a visit takes at your active site — not docked, work not started, unloading, still at the dock, not departed, a dropped trailer not collected, and turnaround — grouped by carrier, dock, material, handling mode or week: the number of visits, the typical time (p50), the time 9 in 10 visits finish inside (p90), the mean, the average target and the share over target. It is built from the stage timings every departed visit writes; an administrator can backfill 180 days of history under stage targets. The same figures are the Stage timings dataset of the report builder.